
Follow the steps below to get it working and perhaps identify where it is not.
Check how the tag manager is implemented in the source code.
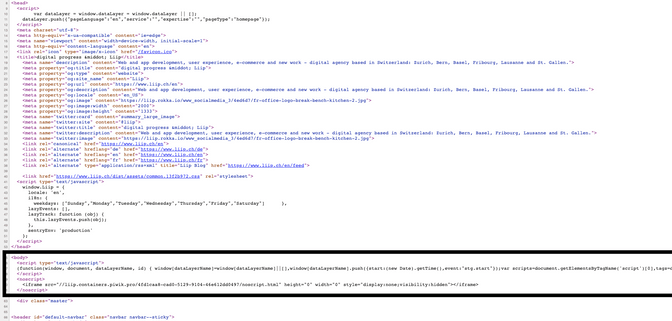
- Navigate to the website and open the developer console by left clicking on the page and opening the source code
- A correctly implemented tag manager snippet should appear in the head (for Google Tag Manager and Matomo), in the body for Piwik PRO.
- Find the snippet and check that the container ID is correct. For GTM, this ID will look something like: GTM-XXXXX . For Matomo you are looking for a site ID and for Piwik PRO you are looking for a long string of numbers and letters.
- If you cannot find the snippet or the container ID anywhere then you will have to add it. Go to your tag management tool and find the implementation code for your account and add this to all pages you want the tag manager to collect data on.
- If your snippet is there, you can move to the next step.
Check the Network tab by left clicking the website and clicking on inspect.
- Once the network tab is open, reload the page and view how network requests start flowing in.
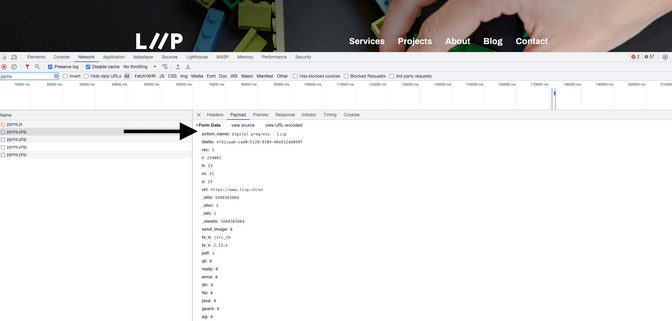
- Locate the tag manager network request by either manually searching for a collect event name or using the search bar. “Collect?” is the GTM network request, mtm is Matomo and ppms is for Piwik PRO. Learning your tag managers network request name and debugging will instantaneously become easier and faster.
- If you are seeing a collect event, then click on it and review the headers tab to confirm that it is indeed a google-analytics tag. You can identify this by looking under the Request URL. Now check the Payload tab to identify the following information: What type of tag is it? Pageview? Event? Ecommerce?
- Is the data being sent to your analytics tool? Check the _id: or tid: to confirm correct Analytics account ID
- This can be a chance to also review the data quality - if you have any custom dimensions setup, this is where you should find them and if you were referred to by another URL, you can also check that this is being filled correctly
- If you do not see a collect event, there are a few things you can try.
- Ensure that the tag manager is setup correctly - meaning, correct domain for the configuration tag
- Check the console tab to see if your tag manager is being blocked
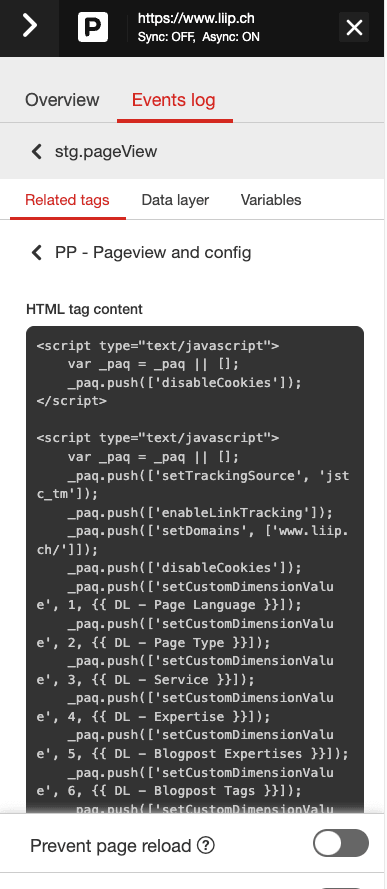
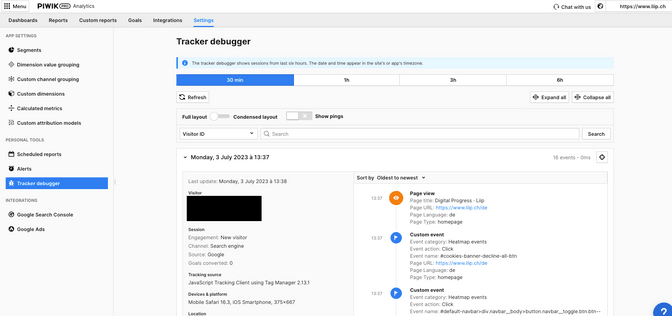
Collect events are present, time to check out the tag manager debug mode
- Most tools will have a debug mode, use it to review what data is being sent and under what conditions. Systematically go through each tag and check the data quality. I like to also have the developer tool open at the same time to cross check.
- Above is the debugger from Piwik PRO, I really like how it performs and its easy to use. For Piwik PRO, you might need to upend the URL with "?stg_debug" , so for example for Liip.ch, it would be "https://www.liip.ch/en?stg_debug"
Now its time to check out your analytics tool reports
- Some tools have a real-time report, others might need one day for data to flow in.
- If you have the real-time report, check this and confirm your interactions with the website
Give it a day and check the standard reports
- Once you have found the events in the debugger, the moment of truth is to also confirm that data is available in your reports
- Make sure to check if variables are being filled correctly
I hope these steps will help you to get your analytics installation working and collecting correctly. If you are still struggling, you can always reach out to me and the team - would be happy to support you. As well as coaching you on your installation and tools, we also provide services in conceptualising and implementing analytics setups, big and small.
If you are curious why you would use a tag manager at all, check out this blogpost: https://www.liip.ch/en/blog/what-is-a-tag-manager