
Typical Problems
In data science we are often dealing with classification problems: We want to predict a finite number of outcomes from our data.
Some typical problems are:
- Distinguish fraud from valid transactions.
- Identify customers that need attention asp.
- Use skin images to detect skin cancer.
- Pick out fake news.
- Identify handwritten symbols.
The steps in data science
In most data science problems there are 3 steps:
- Data Collection
- Feature Engineering
- Tuning an Algorithm
Let's take a look at those steps in more detail:
Data Collection
Often the data is given to you. At other times you decide yourself what data to collect.
Feature Engineering
This step prepares the data for the classification algorithm.
Here are some examples of what can be done in this step:
- Drop fields that are not relevant.
- Transform categorical fields into numeric values.
- Normalize the data, for example scale them such that the variance is always one.
- Orthogonalize the features to get them independent from each other.
These are relatively simple measures, but Feature Engineering can also be very complex.
Feature Engineering for image data
Image pixels are just not helpful as features. There is no way how you could use them directly for detecting skin cancer for example.
Therefore with image data you often try to derive better features from the images by running them through a deep neural network that has been pretrained with general image data. To do that you remove the classification layer of the pretrained network and replace it by your own classification layers. The output of the pretrained network with the classifiation layer removed can be regarded as high level features for your images.
Tuning an algorithm
While you can use pretrained algorithms for your feature engineering in the end you always have to train your own algorithm.
This step has a lot of insecurities:
- You need to get the parameters right.
- Intialization matters.
- Batch size matters.
- Choice of test versus training data matters.
- There are a lot of different algorithms to chose from.
Since this final step takes so much effort, you normally want to make sure that your features are good enough before you start finetuning an algorithm.
The quality of features
So the question in feature engineering is always, when are we done with it. How can we be sure that our features have a good quality.
What does feature quality mean?
What we want to classify are objects. These objects are representated by their features. So what we hope for is that objects that belong to different classes also differ significantly regarding their features. Then we stand a fair chance of classifying them.
Example: Fruit market
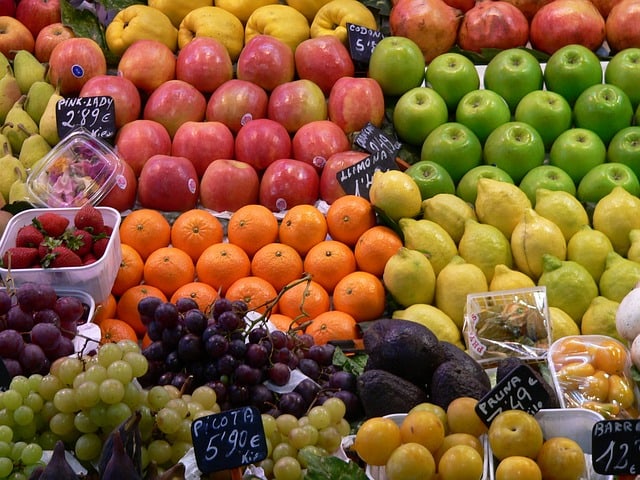
- the size might be a good feature to distinguish between grapes and apples, but not helpful to tell apples and oranges apart.
- the color might be helpful to decide between apples and oranges.
- the combination of size and color might be good enough to classify all the fruits on the photo above.
How can we judge our features?
For judging our features the easiest thing would be to visualize them. If we have only 2 features we can draw them on a map.
Example Iris data
The Iris data are a typical toy dataset. They come with 4 features and 3 species (see for example https://bokeh.pydata.org/en/latest/docs/gallery/iris.html)
You can easily plot 2 features on a map. But that way you can only judge on the combination of 2 features.
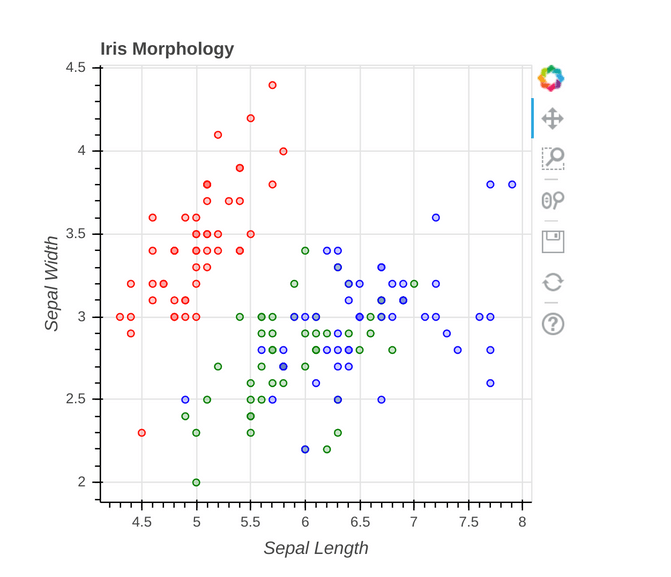
Here you immediately see that these sepal length and sepal would not suffice to tell all three iris species apart.
But what we are interested in is not the pairs of two features, but in the combination of all of them.
Dimensionalty Reduction
So the problem of visualizing the features becomes one of dimensionality reduction: We want to map high dimensional feature spaces onto 2 or 3 dimension in order to visualize the distribution of the features regarding the classes.
Real world problems often have a lot of features
The data that we are given in real problems are often very complex. It is often unknown which features will be relevant.
In the case of the image data we have neural networks picking the features by themselves: So we don't even understand what the features mean since they have been picked by a machine.
So how can we put the features on a map?
Feature spaces are usually high dimensional vector spaces. So how can we map them onto 2 or 3 dimensions?
Linear Mappings
In vector spaces there is linear projection as one method to reduce dimensionality. But linear projections may map distant objects to nearby points, or even to the same point.
PCA stands for Principal Component Analysis. This method is a linear projection that optimizes the choice of the plane to project onto in such a way that it computes the 2 directions, that show the most feature variance.
Even though this sometimes may be a good enough, we can do better.
We can do that by just looking for a set of points in the plane that have a similar structure to the objects in features space: When the objects are close in feature space, the corresponding points in the plane should also be close to each other and vise versa. We no longer require a linear map from the feature space to the plane, in fact we do not require any such map at all.
t-SNE embedding
t-SNE stands for t-Distributed Stochastic Neighbor Embedding.
It constructs a probability distribution of the vectors in the feature space and finds a similar distribution for them as points on a map. That means that objects that are close to each other in feature space have a high probablity of ending up close to each other on the map and vise versa.
It contains a lot of randomness. If you perform the t-SNE twice the result will slightly differ each time. There are also parameters that go into it. If t-SNE does not give you a good result, it might just be that you got those parameters wrong.
Despite those inaccuracies the t-SNE visualization works surprisingly well in practice.
t-SNE was developped 2008 by Laurens van der Maaten and Geoffrey Hinton. Here is a link to page Laurens van der Maaten's own page on the t-SNE, where you can find further literature on it: https://lvdmaaten.github.io/tsne/
Examples
So far this might sound all very dry to you. When I first learned about t-SNE it was on
Kaggle, a place where data scientists compete against each other and practice their skills. I participated in a contest on insurance data, where it was not at all clear whether the features we were given were meaningful. Someone used t-SNE and when I learned about it,
I got hooked and it has now a fixed place in my datascience tool kit. I try it on almost every data science problem I encounter.
To fill t-SNE with practice, I will take you through some of my examples:
Titanic
The first example is the Titanic. This is a well known beginner's task for future data scientists on Kaggle:
You get the historic passenger list of the Titanic and have to predict which passengers will survive the catastrophy. This shouldn't be 100% predictable, but there might be certain privileged or underprivileged passengers that have a higher or lower likelyhood to survive.
Here is the t-SNE visualization for this problem that I published on Kaggle
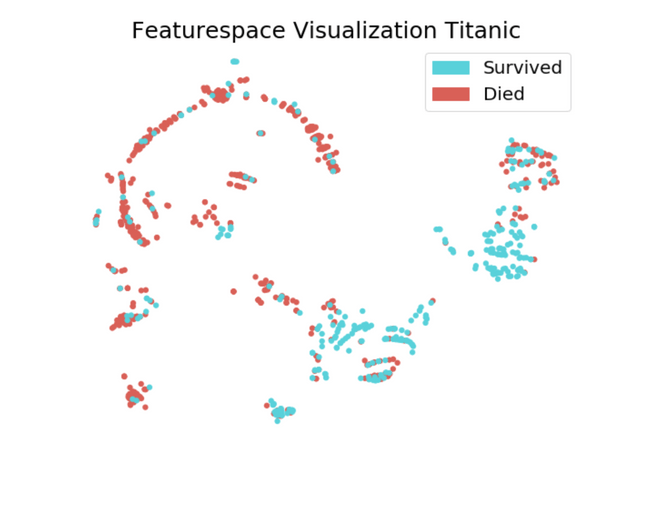
Conclusion
- There are clusters where the majority of people survived. (Privileged passangers: women, children and 1st class?)
- There are other clusters (red) where the majority of people died. (Under privileged passenger: men and 3rd class?)
- Most clusters seem to be mixed to a certain degree, this is in accordance to the fact that fate will certainly have played a role in this.
Source: https://www.kaggle.com/sabinem/titanic-survivor-geometry
Epilepsy
This was another dataset on Kaggle:
- The task was to tell seizures apart from normal brain activity.
- It was supervised learning with two outcomes: seizure or normal.
Here you can see the t-SNE that I computed for this task after some basic normalization of the data:
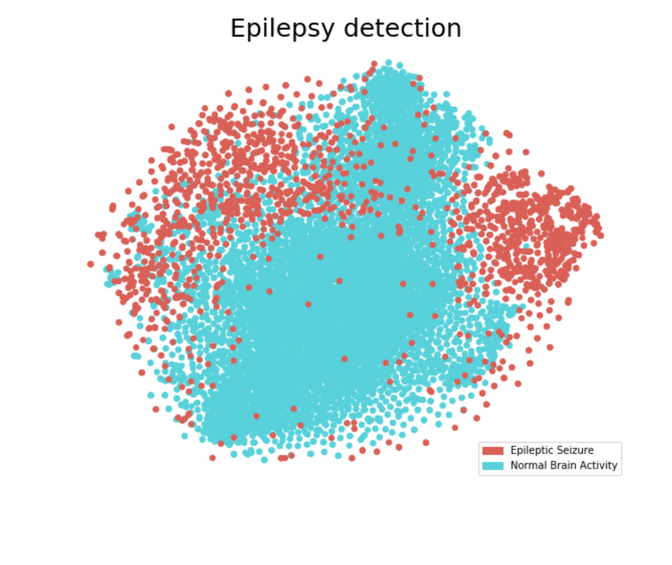
Conclusion
- the seizures where mostly detectable
- the border between normal and seizure was fluent and not clear cut
Source: https://www.kaggle.com/sabinem/geometry-of-epilepsy-detection
Dog Breeds
I did this in a data science class, therefore I cannot publish my computations.
The task was to build a classifier for dog images, that would be able to distinguish between 137 different dogbreeds: If you show it a photo of a dog, it should be able to tell you the breed.
That is not an easy task, at least it would not be for me as a human.
For this task we were given pretrained image classifiers built by Google. These are publicly available. You can think of them as machines which were trained on a very general task of image classification. Then you take the classfication layer off and feed them with your own data. For the classification task we had to replace the original classification layer with our own classification layer.
We were given 4 pretrained Google image classifiers to chose from: So how would we know which one of these would give the best results?
This is again a question about feature quality. So I used t-SNE to visualize the feature quality of each pretrained classifier.
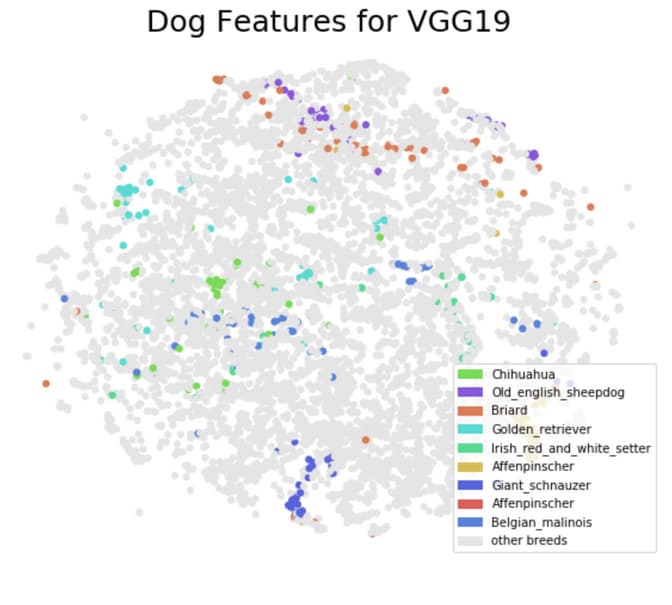
Below you can see the t-SNE visualization for two of pretrained classifiers VGG-19 and ResNet-50:
- VGG-19 has 19 layers
- ResNet-50 has 50 layers
Both are convolutional neural networks that were trained on more than one million images from the ImageNet database. There input are 224-by-224 images. They were pretrained to distinguish between 1000 object and animal categories.
In the picture I just highlighted 9 different dog breeds that I chose randomly in order to see how good the pretrained neural networks were separating the dog breeds:
Pretrained with VGG19
Pretrained with ResNet50
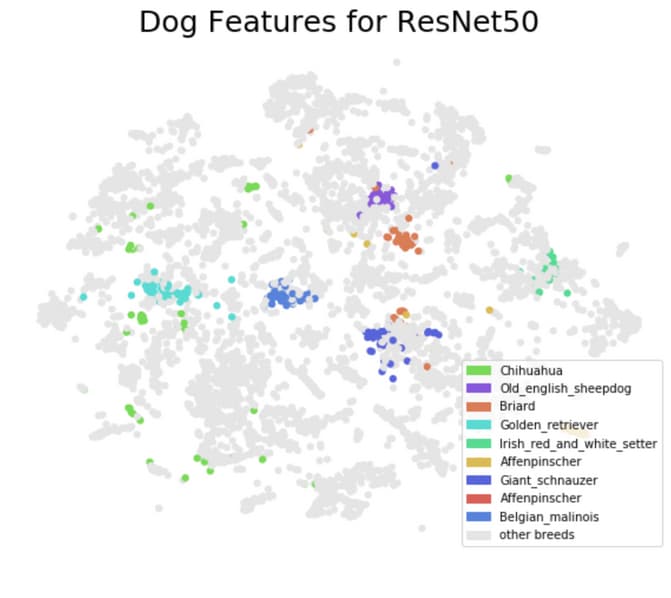
Conclusion
- With ResNet-50 the clustering is a lot better regarding the dog breeds. There are almost no mixed clusters,
- even though some dog breeds such as the Chihuahua are quite spread out.
- With VGG-19 on the other hand only some breeds such as the Giant Schnauzer form clusters at all. Most breeds are quite spread out.
- I went with ResNet-50 and got 82 % accuracy, meaning the dog breed was identified correctly in 82% of the cases.
t-SNE as recommender sytem for Freitag bags
Liip recently developed a recommender system as prototype for Freitag, a company that sells bags. The protype uses t-SNE to come up with a map that places similar bags next to each other. This enables the consumer to chose a bag that matches their taste by gradually moving through a plane of choices grouped by similarity.
For more details see on our Data Services Gallery.