
Debugging in node applications like Nuxt 3 is quite complex. Usually code is written in Typescript that needs a compilation to JS. Vue 3 components with the <script setup> syntax are also compiled into Javascript by the Vue 3 compiler.
In order to use breakpoint, we first have to enable and output sourcemaps. Sourcemaps are enabled for your server build by default, and for the client build in dev mode, but you can enable them more specifically in your configuration.
export default defineNuxtConfig({
  sourcemap: {
    server: true,
    client: true
  }
})
Be careful: I also tried sourcemap: true. But if you define it like that, then you can't debug *.vue files because of missing source maps. Use the exact definition as above.
The journey begins
UPDATED 22.05.2025: Previous Nuxt 3 issue was fixed and patching is no longer needed!
Before you start, make sure, that you are on a current Nuxt version, >3.17 or higher.
Previous Nuxt versions (nuxi) had a bug, that did not pass the correct inspect parameters to the child process of Nuxt. This was fixed with this pull request. The related issue is here
Adapt the package.json like this:
"scripts": {
  "debug": "nuxi dev --inspect",
  ...
}
Unfortunately, this only works if you start your Nuxt 3 application locally. The next chapter explains how to debug a Nuxt 3 application in a container.
Debugging Nuxt3 in a Docker Container (example with DDEV)
I'm running Node inside the DDEV web container, but the procedure is the same for any Docker based setups.
Step 1: Expose the Node debugger port inside your container to the container host
Add a new file called .ddev/docker-compose.node-debug.yaml:
services:
  web:
    ports:
      - "28111:9229"
This will explose the port 9229 inside the container accessible from the host machine via port 28111 (randomly selected).
Adapt the package.json to listen on all IP addresses with the debugger
To be able to connect from the host machine to the debugger inside the docker container we need to adapt the our package.json like this:
"scripts": {
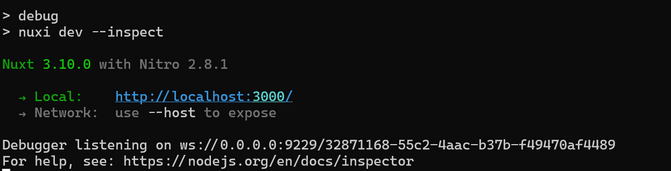
"debug": "nuxi dev --inspect=0.0.0.0",
...
}Thanks to the fix mentioned above, the parameter will be passed to the child Nuxt application.
Attach the debugger with PHPStorm / WebStorm
Now, you can attach the debugger to the running node process inside the container like this:
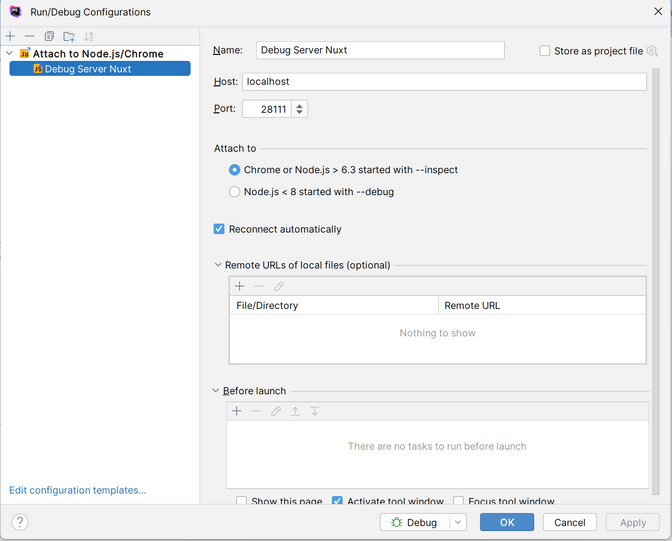
- Add a new Debug Configuration
- Select “Attach to Node.js / Chrome”
- Configure the exposed port
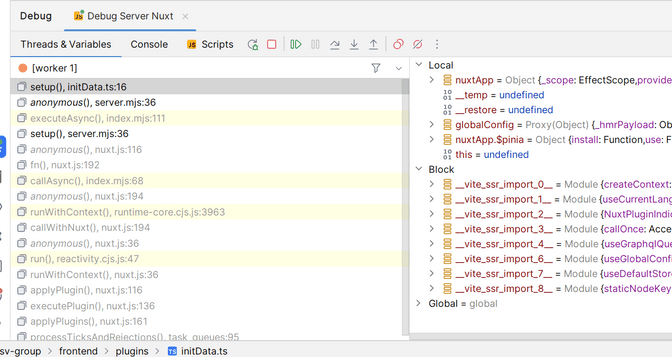
Start your application with npm run debug, set a breakpoint, and then attach the debugger.
Enjoy the power of Node debugging!
Attach the debugger with VSCode
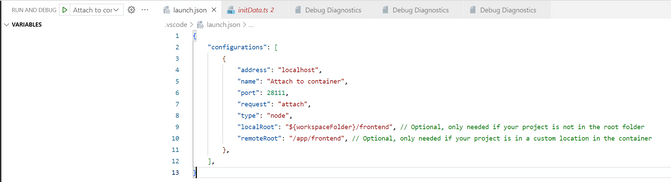
Create a .vcode/launch.json or extend it with the following configuration:
{
    "configurations": [
        {
            "address": "localhost",
            "name": "Attach to container",
            "port": 28111,
            "request": "attach",
            "type": "node",
            "localRoot": "${workspaceFolder}/frontend", // Optional, only needed if your project is not in the root folder
            "remoteRoot": "/app/frontend", // Optional, only needed if your project is in a custom location in the container
        },
    ],
}
The localRoot and the remoteRoot are only needed if you have some special subfolder mapping between the container and the localRoot. In this example, the frontend lives in a project subfolder. Remove it if you have a single Nuxt 3 installation.
Start your application with npm run debug, set a breakpoint, and then attach the debugger.
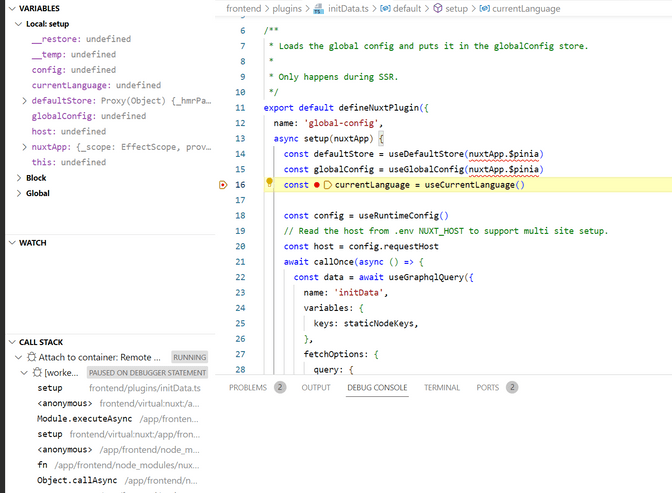
Enjoy the power of Node debugging!