
This is most presumably the last post about 72stunden.ch and just a little graph, which shows the traffic on the 72stunden.ch proxy/load balancer during the weekend:
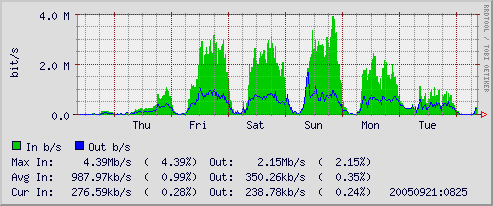
Green is the output traffic (from the server point of view, the legend on the picture is from the provider point of view) and blue the input, which is basically what came from the backend-servers. The difference is therefore, what the caching saved us from hitting the backend network. I assume, that when a lot more people would have visited the website, the blue line wouldn't have gotten much higher, just the green one.
The constant line on the night from Monday to Tuesday is by the way someone who leeched the whole website with httrack, obviously on a 256kbit/s line (or he limited it to 256kbit/s). The peak values are 5 minute average times and not the real peaks.