

What is Google Search Console?
Google Search Console is a free tool made available by Google to help SEO specialists (like me), website owners and anybody managing a website to understand how a website performs on Google Search. By using Google Search Console, you can improve your search appearance. From an SEO point of view, Google Search Console will help your technical SEO as much as your on-page SEO.
What information can you obtain from the Google Search Console?
You can obtain multiple information from the Google Search Console, for example:
- What are the performances of your website?
- Do you have crawling or indexing problems?
- Do you have manual actions?
- Do you need to improve the speed of your website?
- Have you implemented schema.org correctly?
These are just some of the questions we can answer thanks to the Search Console.
Discover how we can support you with technical & On-page SEO.
What is the Google Search Console performance report?
The performance report helps to answer the first question:
What is the performance of my website?
Which data are available in the Google Search Console performance report?
The performance report, also called the search results report, depending on how your Search Console is structured, shows important metrics on how you are performing on Google, as we can see from the short video. This report gives you important metrics such as total clicks and total impressions, as well as CTR (click-through rate) and position. It’s important to note that Total impressions shows how many links to your site a user sees on Google Search results.
You can see for which query and pages you are showing up on Google. You can also see from which country and device the traffic is coming. Last but not least, you can also see your search appearance.
video:
How can you take advantage of the Google Search Console performance report?
Why is search appearance important?
Let’s take a hypothetical example to demonstrate which information you can obtain from search appearance. Let's take a hypothetical example.
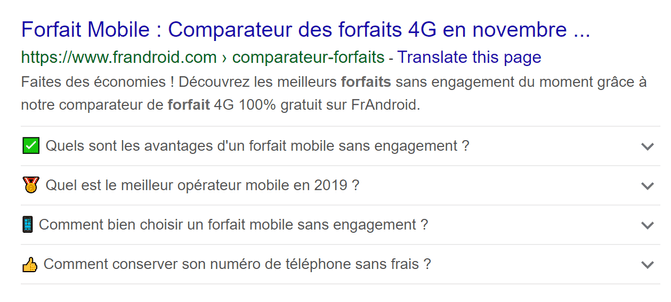
If I type “forfait mobile” in Google, one of the results on page one will be the following. From this result, I can tell that Frandroid is using schema.org FAQ on this page. And I know from testing that this page comes up for the query “forfait mobile”. As an owner of a website or an SEO specialist, you want to know what query triggers your rich result without the need to test it yourself as you have millions of possible queries. You can subsequently put extra effort into that specific area.
First, you need to go to your Search Console → performance report → appearance as in the image below.
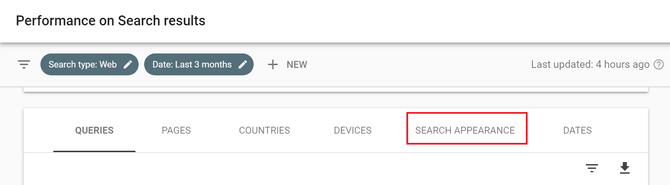
Next, you can select the appearance view that you wish to have (see image below).
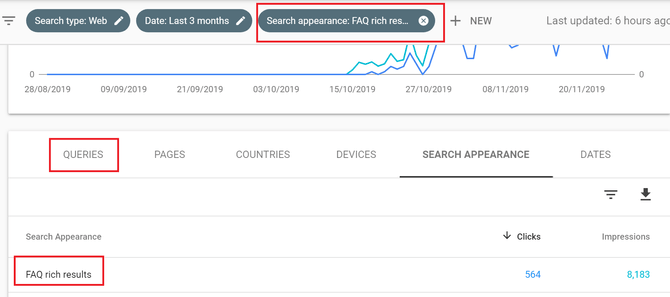
If you select in search appearance: FAQ rich results, then you will have a filter called “Search appearance: FAQ rich results”. Next, you need to select queries.
I’m sure that, if we would have access to the Frandroid Search Console (the company in the Google image), we would find “forfait mobile” in the list of queries for FAQ rich results.
The same logic to create filters can be applied to the entire report. For instance, as you can see in the video below, if you want to know for which query a specific page appears in a search:
- Select a URL in the propriety.
- This will generate a filter.
- Go to queries dimension.
video:
It's important to note that if your website gets a lot of traffic from Google Discovery, then you can also access a report called “discovery” which gives similar information to the performance report.
Apart from the performance report – when discovering a new website – my favourite report is the coverage report.
What is the Google Search Console coverage report?
This report will answer the following question:
“Do you have any crawling or indexing problems?”
This is how Google defines theindex coverage report:
“This report shows the indexing state of all URLs that Google has visited, or tried to visit, in your property. The summary page shows the results for all URLs in your property grouped by status (error, warning, or valid) and specific reason for that status (such as Submitted URL not found (404)). Click a table row in the summary page to see all URLs with the same status/reason and more details about the issue”
To understand the coverage report, it’s useful to review how Google works:
Google will find a link. Next it will crawl the link then index the link. If your website has JavaScript then you will have an extra phase: rendering. If you want to dive deeper into the difference between crawling and indexing, check out the blog post “How to find and fix Google indexing issues”. If you want to better understand what role JavaScript plays in indexing, check out the Martin Splitt videos on How Google Search indexes JavaScript sites
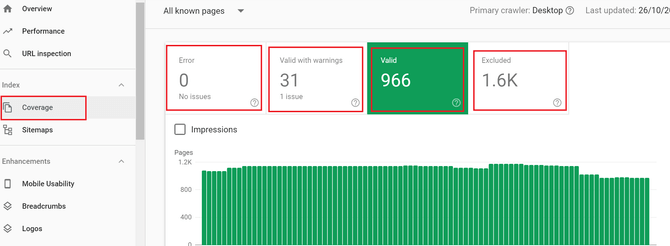
As we can see from the image below, there are four sources of information:
- Error
- Valid with warnings
- Valid
- Excluded
How can you take advantage of the Google Search coverage report?
The Google Search coverage report helps you identify possible technical issues with your website. For instance, you can see if a crawler can’t crawl a website or if there is a problem with indexing.
Google provides information to help you understand what problem the crawler faced.
Let’s look at the most common errors I’ve spotted on websites
Errors include pages that are not indexed. Google gives a list of errors that you can find here. From my point of view, the most common errors are:
- Submitted URL blocked by robots.txt
Normally, this means that you submitted a sitemap with a specific URL, and that the URL is blocked by the robots.txt.
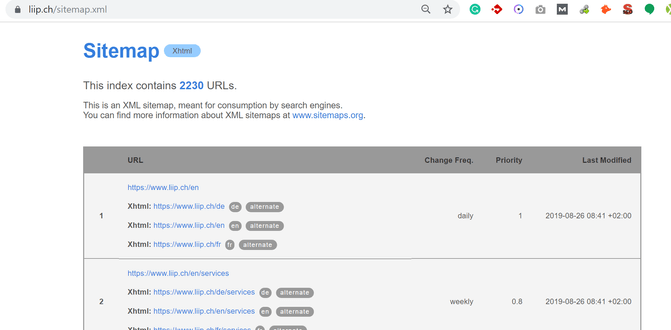
What is an xlm sitemap?
An XML sitemap is a list of important URL pages. Pages that you want Google to find and crawl.
What is a robots.txt?
A robots.txt is a text file to instruct web robots on how to crawl pages on a website. For instance, in a robots.txt file, you will add a list of pages allowing or disallowing a robot to crawl a specific page.
As in the example below.
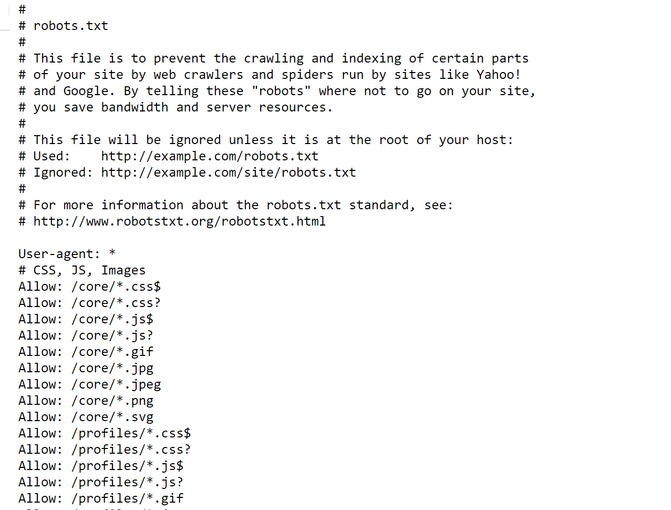
To sum up, submitted URL blocked by robots.txt means that you are adding a link in the sitemap so that Google can crawl it, and at the same time in your robots.txt file you are telling Google to not crawl the URL.
- Redirect error
Google says that under the redirect errors category you find:
“redirect chain that was too long; it was a redirect loop; the redirect URL eventually exceeded the max URL length; there was a bad or empty URL in the redirect chain”.
In my experience, I’ve seen several redirect chain problems and bad or empty URLs.
The image below is an example of an empty URL:
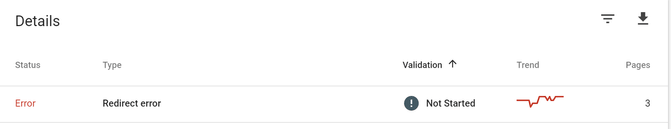
I crawled the website with Screaming Frog (a crawling tool), and what I learned is that URLs were redirected but there were no destination URLs. As a result, Google indicates this as a redirect error.
- Server errors
In the search console, you will have under type: server error (5xx)
Let’s look at what Warning means
Warning means that the page is indexed, but has an issue that you should be aware of.
I’ve noticed that sometimes pages that are under the category warning get transferred to error. So make sure you solve the warnings problems as fast as possible.
If you take the previous example, you will typically find in warning “Indexed, though blocked by robots.txt” in this section. Next, this warning will be moved to errors.
Let’s look at valid pages
Valid pages are pages that are indexed. This allows you to check if important pages are indexed and if the number of indexed pages looks good to you.
The next report we will see is the URL inspection report.
What is the Google Search Console URL inspection?
The URL inspection report and the coverage report are sort of connected. Thanks to the URL inspection report, we can inspect a specific URL.
The URL inspection report will answer the question:
Do you have crawling or indexing problems? This will be for a specific URL.
How can you take advantage of the URL inspect report to discover indexing problems?
Let’s take the example of the Liip home page in English. As you can see from the image below, we know that the URL is on Google.
What I like about this report is that you can test the URL live. Why is that? The information you see in the report is from the last time the page was crawled. Thanks to the live URL test, the page can be crawled on the spot and you can gather new data.
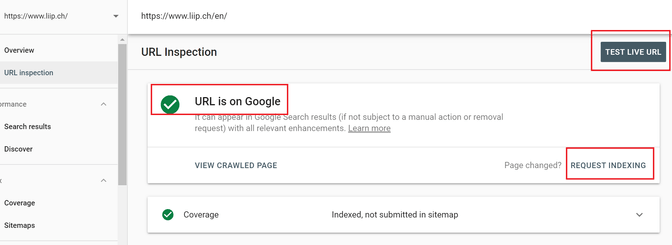
How can you take advantage of the URL inspect report if you have fresh content?
Another important feature that exists with URL inspect is that you can submit a new URL or new content for indexing.
What are the Google Search Console enhancement reports?
The enhancement reports help to answer the following questions:
Do you need to improve the speed of your wbsite?
Have you implemented schema.org correctly?
Under enhancement reports you find a list of reports that help you understand:
- If your markups are implemented correctly,
- If you need to improve your time speed,
- If you need to improve mobile usability.
It’s important to note that if you add schema.org (markup) through Google Tag Manager you will not see results in the search console, this report is only valid for schema.org implemented in the website directly.
What data are available in the Google Search Console speed report?
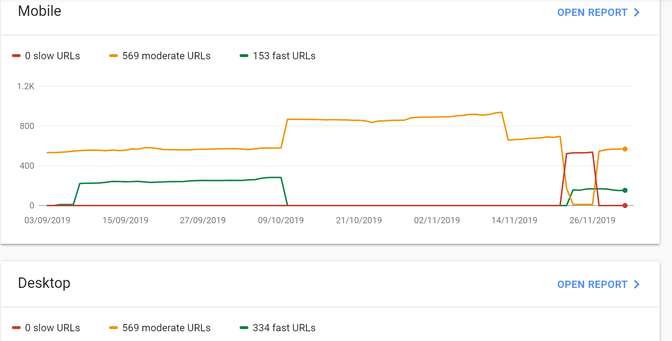
The first thing that you can see is if there is a difference between the desktop and mobile performance. As we can see from the image above, we have an average time speed.
Google tells us that the First Contentful Paint (FCP) takes more than one second.
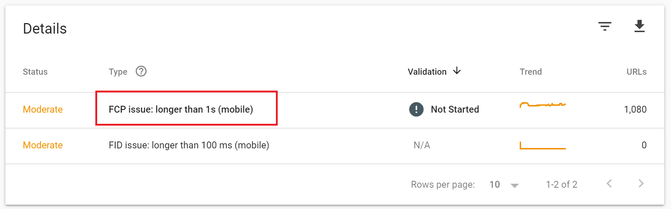
You are probably asking yourself what an FCP & FID are?
FCP: "measures the time from navigation to the time when the browser renders the first bit of content from the DOM".
First input delay (FID) measures the time from when a user first interacts with your site to when the website actually responds to the user. For instance, if you are trying to interact with a website but the website doesn’t completely load then it means that the FID took too long.
How can you see if FCP & FID are a problem?
pagespeed insight or GTmetrix are a very good start to help you understand if there is a problem & where the problem comes from.
What information is available from the mobile usability report in the Google Search Console?
As we can see from the video below, Google shows three main problems for the same URL:
- Text too small to read
- Clickable elements are too close together
- Content wider than screen
All these elements are useful information for designers and IT specialists who can correct the usability of the website.
What information is available from the schema enhancement report in the Google Search Console?
The enhancement reports have a structure very similar to the coverage & usability report. As we can see from the image below. The enhancement report will help you understand which parts of schema.org are wrongly integrated.
What next?
I hope this blog post has been helpful in acquiring new competences with the search console. If you want a live demo, don’t miss our next SEO Meetup on the search console. For more workshops & meetups regarding SEO, join #SEOnerdSwitzerland. You can also follow the new series of videos produced by Google dedicated to the Search Console.
If you want us to audit your website or increase your traffic contact our SEO team:
for English, French & German.