
The facebook scandal or the tempest in a teapot seems to be everywhere these days. Due to it Facebook has lost billions in stock market value, governments on both sides of the Atlantic have opened investigations, and a social movement is calling on users to #DeleteFacebook. While the press around the world and also in Switzerland are discussing back and forth, how big Facebook’s role was in the current data miss-use between, I thought it would be great to answer three central questions, which even I had after reading a couple of articles:
- It seems that CA obtained the data somewhat semi-legally, but everyone seems very upset about that. How did they do it and can you do it, too? :)
- People feel manipulated with big data and big buzzwords, yet practically how much can one deduce from our facebook likes?
- How does the whole thing work, predicting my most inner psychological traits from facebook likes, it seems almost like wizardry.
To provide answers to these questions I have structured the article mainly around a theoretical part and a practical part. In the theoretical part I'd like to give you an introduction on psychology on Facebook, explaining the research behind it, showing how such data was collected initially and finally highlighting its implications for political campaigning. In the practical part I will walk you through a step by step example that shows how machine learning can deduce psychological traits from facebook data, showing you the methods, little tricks and actual results.
Big 5 Personality Traits
Back in 2016 an article was frantically shared in the DACH region. With its quite sensation-seeking title Ich habe nur geziegt dass es die Bombe gibt, the article claimed that basically our most “inner” personality traits - often called the big 5 or OCEAN - can be extracted from our Facebook usage and are used to manipulate us in political campaigns.
This article itself was based on the research paper of Michal Kosinski and other Cambridge researchers who studied the correlation between Facebook likes and our personality traits, while their older research about this topic goes even back to 2013. Although some of these researchers ended up in the eye of the storm of this scandal, they are definitely not the only ones studying this interesting field.
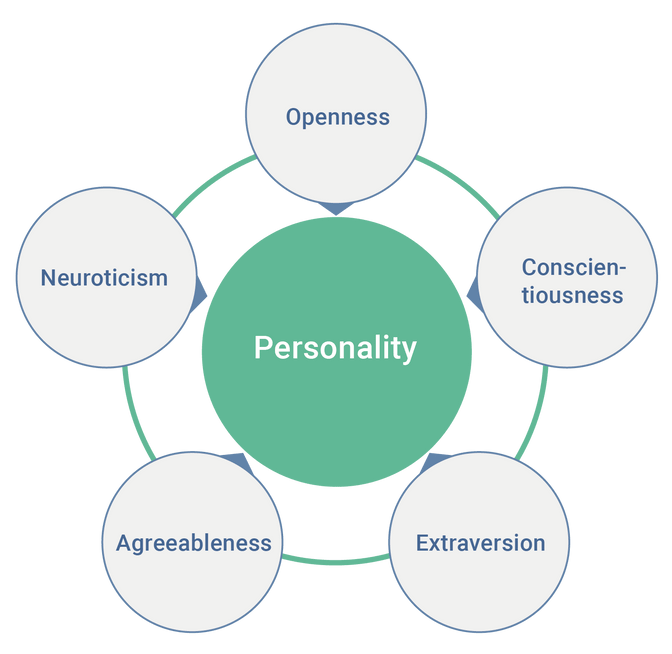
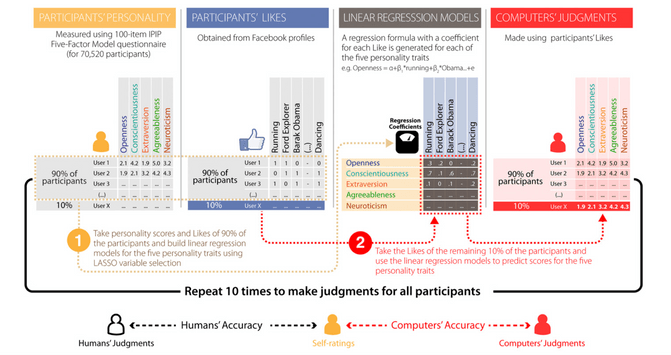
In the OCEAN definition our personality traits are: openness to experience, conscientiousness, extraversion, agreeableness, and neuroticism. While psychologists normally have to ask people around 100 questions to determine these traits - you can do an online test yourself online to get an idea - the article discussed a way where Facebook data could be used to infer them instead. They showed that "(i) computer predictions based on a generic digital footprint (Facebook Likes) are more accurate (r = 0.56) than those made by the participants’ Facebook friends using a personality questionnaire (r = 0.49)". This basically meant that by using a machine learning approach based on your Facebook data they were able to train a model that was better in describing you, than a friend of yours. They also found out that, the more facebook likes they have for a single person, the better the model is predicting those traits. So as you might have expected having more on users pays off in these terms. The picture below shows a birds-eye view of their approach.
They also came to the conclusion that "computers outpacing humans in personality judgment, presents significant opportunities and challenges in the areas of psychological assessment, marketing, and privacy." So in other words hinting that their approach might be quite usable beyond the academic domain.
Cambridge Analytica
This is how Cambridge Analytica (CA) comes into play, which has its name originally from the cooperation of the psychometrics department in Cambridge. Founded in 2014, their goal was to make use of such psychometric results in the political campaign domain. Making use of psychometric insights is nothing new per-se since at least the 1980ties different actors have been making use of various psychometric classifications for various applications. For example the Sinus Milieus are quite popular in the DACH region, mainly for marketing areas.
The big dramatic shift in comparison to these “old” survey based approaches is that CA was doing two things differently: Firstly they focused specifically on Facebook as a data source and secondly they used Facebook as a platform primarily for their interventions. Instead of asking long and expensive questionnaires, they were able to collect such data in an easy manner and also, they reach their audience in a highly individualized way.
How did Cambridge Analytica get the data?
Cambridge researchers had originally created a Facebook app that was used to collect data for the research paper mentioned above. Users filled out a personality test on Facebook and then agreed on, that the app can collect their profile data. There is nothing wrong with that, except for the fact that at this time Facebook (and the users) also allowed the app to collect the personality profiles of their friends, who never participated in the first place. At this point I am not sure which of many of such apps (“mypersonality”, “thisisyourdigitallife” or others) was used to gather the data, but the result was that with this snowball system approach CA quickly collected data about roughly 50 Mio users. This data became the base for the work of CA. And CA was heading towards using this data to change the way political campaigns work forever.
Campaigns: From Mass communication to individualized communication
I would argue that the majority of people are still used to the classic political campaigns that are broadcasted to us via billboards-ads or TV-ads and have one message for everybody, thus following the old paradigm of mass communication. While such messages have a target group (e.g.women over 40), it is still hard to reach exactly those people, since so many other people are reached too, making this approach rather costly and ineffective.
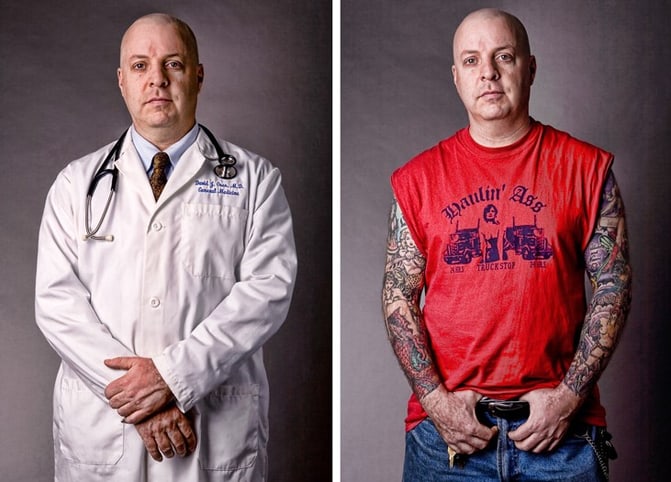
With the internet era things changed quickly here: In nowadays online advertising world a very detailed target group can be reached easily (via Google Ads or Facebook advertising) and each group can potentially receive a custom marketing message. Such programmatic advertising surely disrupted the adverising world, but CA’s idea was not to use this mechanism for advertising but for political campaigns. While quite a lot of details are known about those campaigns and some shady practices have been made visible, here I want to focus on the idea behind them. The really smart idea about these campaigns is that a political candidate can appeal to many different divergent groups of voters at the same time! This means that they could appear as safety loving to risk-averse persons and could appear as risk-loving to young entrepreneurs at the same time. So the same mechanisms that are used to convince people of a product are now being used to convince people to vote for a politician - and every one of these voters might do so because of individual reasons. Great isn't it?
This brings our theoretical part to the end. We know now they hows and whys behind Cambridge Analytica and why these new form of political campaigns matter. It's time now to find out how they were able to infer personality traits from facebook likes. I am sorry to disappoint you though, that I won’t cover on how to run a political campaign on Facebook in the next practical part.
Step1 : Get, read in and view data
What most people probably don’t know is, that one of the initial projects website still offers a big sample of the collected (and of course anonymized) data for research purposes. I downloaded it and put it to use it for our small example. After reading in the data from the csv format we see that we have 3 Tables.
users = pd.read_csv("users.csv")
likes = pd.read_csv("likes.csv")
ul = pd.read_csv("users-likes.csv")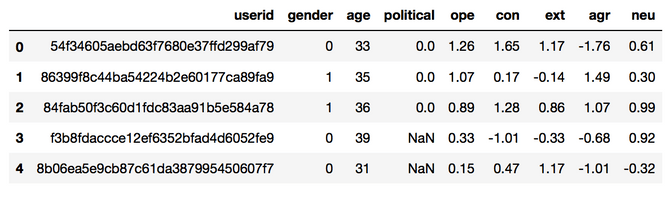
The user table with 110 thousand contains information about demographic attributes (such as age and gender) as well as their measurements on the 5 different personality traits: openness to experience(ope), conscientiousness(con), extraversion(ext), agreeableness(agr), and neuroticism(neu).
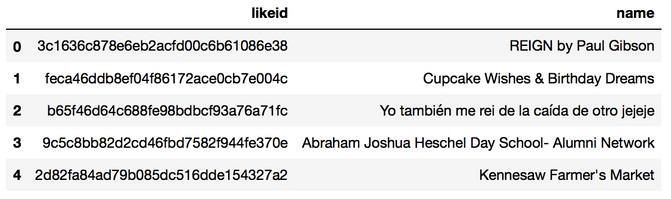
The likes table contains a list of all 1.5 Mio pages that have been liked by users.
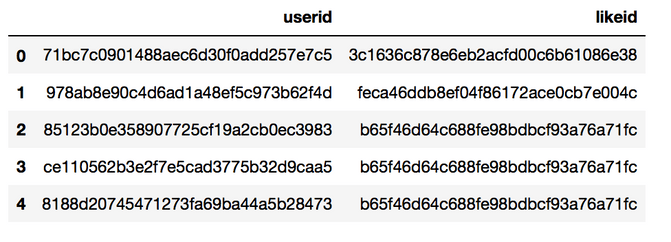
The edges table contains all the 10 Mio edges between the users and the pages. In fact seen from a network research perspective our “small sample” network is already quite big for normal social network analysis standards.
Step 2: Merge Users with Likes in one dataframe aka the adjacency matrix
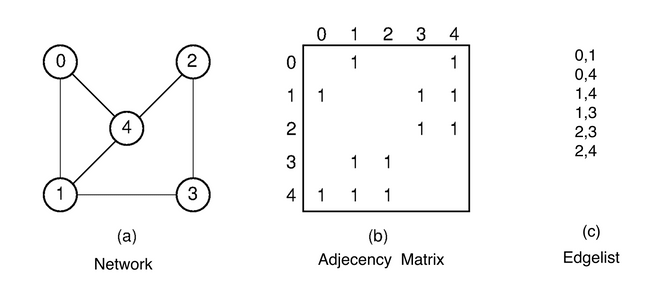
In step 2 we now want to create a network between users and pages. In order to do this we have to convert the edge-list to a so called adjacency matrix (see image with an example below). In our case we want to use a sparse adjacency format, since we have roughly 10 Mio edges. The conversion, as shown below, transforms our edgelist into categorical integer numbers which are then used to create our matrix. By doing it in an ordered way, the rows of the resulting matrix still match the rows from our users table. This saves us a lot of cumbersome lookups.
#transforming the edge list into a sparse adjacency matrix
rows = ul["userid"].astype('category',ordered=True,categories=users["userid"]).cat.codes # important to maintain order
cols = ul["likeid"].astype("category",ordered=True,categories=likes["likeid"]).cat.codes
ones = np.ones(len(rows), np.uint32).tolist()
sparse_matrix = csc_matrix((ones, (rows, cols)))
If you are impatient like me, you might have tried to use this matrix directly to predict the users traits. I have tried it and the results are rather unsatisfactory, due to the fact that we have way too many very “noisy” features, which give us models that predict almost nothing of our personality traits. The next two steps can be considered feature engineering or simply good tricks that work well with network data.
Trick 1: Prune the network
To obtain more meaningful results, we want to prune this network and only retain the most active users and pages. Theoretically - while working with a library like networkx - we could simply say:
«Lets throw out all users with with a degree less than 5 and all pages with a degree of less than 20.» This would give us a network of users that are highly active and of pages that seem to be highly relevant. Often under social network research computing k-cores gives you a similar pruning effect.
But since our network is quite big I have used a poor man's version of that pruning approach: We will be going through a while loop that throws out columns (in our case users) where the sum of their edges less than 50 and rows (pages) where the sum of their edges less than 150. This is equivalent to throwing out users that follow less than 50 pages and throwing out pages that have less than 150 users. Since a removal of a page or user might hurt one of our conditions again, we will continue reduce the network as long as still columns or rows need to be removed. Once both conditions are met the loop will stop. While pruning we are also updating our user and pages lists (via boolean filtering), so we can track which users like which pages and vice versa.
# pruning the network into most relevant users and pages
print(sparse_matrix.shape)
max = 50
while True:
    i = sum(sparse_matrix.shape)
    columns_bool = (np.sum(sparse_matrix,axis=0)>3*max).getA1()
    sparse_matrix = sparse_matrix[:, columns_bool] #columns
    likes = likes[columns_bool]
    rows_bool = (np.sum(sparse_matrix,axis=1)>max).getA1()
    sparse_matrix = sparse_matrix[rows_bool] #rows
    users = users[rows_bool]
    print(sparse_matrix.shape)
    print(userst.shape)
    if sum(sparse_matrix.shape) == i:
        break
This process quite significantly reduces our network size to roughly a couple thousand users (19k) with a couple of thousands pages (8-9k) or attributes each. What I will not show here is my second failed attempt at predicting the psychological traits. While the results were slightly better due to the better signal to noise ratio, they were still quite unsatisfactory. That's where our second very classic trick comes into play: dimensionality reduction.
Trick 2: Dimensionality reduction or in our case SVD
The logic behind dimensionality reduction can be explained intuitively: Usually when we analyse user’s attributes we often find attributes, that describe the "same things" (latent variables or factors). Factors are artificial categories emerge by combining “similar” traits, that behave in a very “similar” way (e.g. your age and your amount of wrinkles). In our case these variables are pages that a user liked. So there might be a page called "Britney Spears" and another one "Britney Spears Fans" and all users that like the first also like the second. Intuitively we would want both pages to "behave" like one, so kind of merge them into one page.
For such approaches a number of methods are available - although they all work a little bit different - the most used examples are Principal component analysis, Singular value decomposition, Linear discriminant analysis. These methods allow us to “summarize” or “compress” the dataset in as many dimensions as we want. And as a benefit these dimensions are sorted in the way that the most important ones come first.
So instead of looking at a couple of thousand pages per user, we can now group them into 5 “buckets”. Each bucket will contain pages that are similar in regard to how users perceive these pages. Finally we can correlate these factors with the users personality traits. Scikit learn offers us a great way to perform a PCA on a big dataset with the incremental PCA method that even works with datasets that don’t fit into RAM. An even more popular approach (often used in recommender systems) is SVD, which is fast, easy to compute and yields good results.
#performing dimensionality reduction
svd = TruncatedSVD(n_components=5) # SVD
#ipca = IncrementalPCA(n_components=5, batch_size=10) # PCA
df = svd.fit_transform(sparse_matrix)
#df = ipca.fit_transform(sparse_matrix)
In the case above I have reduced the thousands of pages into just 5 features for visualization purposes. We can now do a pairwise comparison between the personality traits and the 5 factors that we computed and visualize it in a heatmap.
#generating a heatmap of user traits vs factors
users_filtered = users[users.userid.isin(matrix.index)]
tmp = users_filtered.iloc[:,1:9].values # remove userid, convert to np array
combined = pd.DataFrame(np.concatenate((tmp, df), axis=1)) # one big df
combined.columns=["gender","age","political","ope","con","ext","agr","neu","fac1","fac2","fac3","fac4","fac5"]
heatmap = combined.corr().iloc[8:13].iloc[:,0:7] # remove unwanted columns
sns.heatmap(heatmap, annot=True)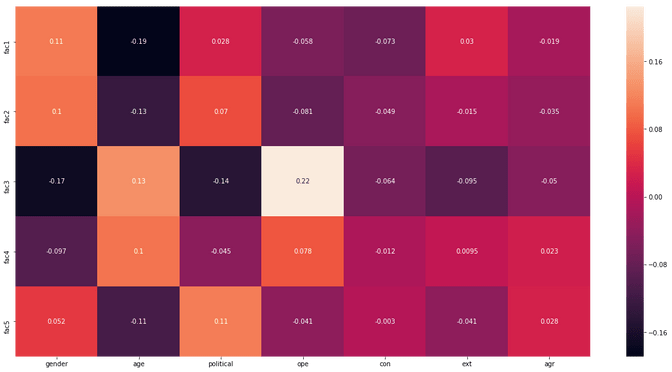
In the heatmap above we see that factor 3 seems to be quite highly positively correlated with the user's openness. We also see that factor 1 is negatively correlated with age. So the older you get the less you probably visit pages from this area. Generally we see though that the correlations between some factors and traits are not very high though (e.g. agreeableness)
Step 3: Finally build a machine learning model to predict personality traits
Armed with our new features we can come back and try to build a model that finally will do what I promised: namely predict the user's traits based solely on those factors. What I am not showing here, is the experimentation of choosing the right model for the job. After trying out a few models like Linear Regression, Lasso or decision trees the LassoLars Model with cross validation worked quite well. In all the approaches I’ve split the data into a test (90% of the data) and training set (10% of the data), to be able to compute the accuracy of the models on unseen data. I also applied some poormans hyperparameter tuning, where all the predictions are going through different variants of k of the SVD dimensionality reduction.
#training and testing the model
out = []
out.append(["k","trait","mse","r2","corr"])
for k in [2,5,10,20,30,40,50,60,70,80,90,100]:
    print("Hyperparameter SVD dim k: %s" % k)
    svd = TruncatedSVD(n_components=k)
    sparse_matrix_svd = svd.fit_transform(sparse_matrix)
    df_svd = pd.DataFrame(sparse_matrix_svd)
    df_svd.index=userst["userid"]
    total = 0
    for target in ["ope","con","ext","agr","neu"]:
        y = userst[target]
        y.index = userst["userid"]
        tmp = pd.concat([y,df_svd],axis=1)
        data = tmp[tmp.columns.difference([target])]
        X_train, X_test, y_train, y_test = train_test_split(data, y, test_size=0.1)
        clf=LassoLarsCV(cv=5, precompute=False)
        clf.fit(X_train,y_train)
        y_pred = clf.predict(X_test)
        mse = mean_squared_error(y_test,y_pred)
        r2 = r2_score(y_test,y_pred)
        corr = pearsonr(y_test,y_pred)[0]
        print('   Target %s Corr score: %.2f. R2 %s. MSE %s' % (target,corr,r2,mse))
        out.append([k,target,mse,r2,corr])
    print(" k %s. Total R2 %s" % (k,total))
To see which amount of dimensions gave us the best results we can simply look at the printout or visualize it nicely with seaborn below. In the case above I found that solutions with 90 dimensions gave me quite good results. A more production ready way of doing is can be done with GridSearch, but I wanted to keep the amount of code for this example minimal.
#visualizing hyperparameter search
gf = pd.DataFrame(columns=out[0],data=out[1:-1])
g = sns.factorplot(x="k", y="r2", data=gf,size=10, kind="bar", palette="muted")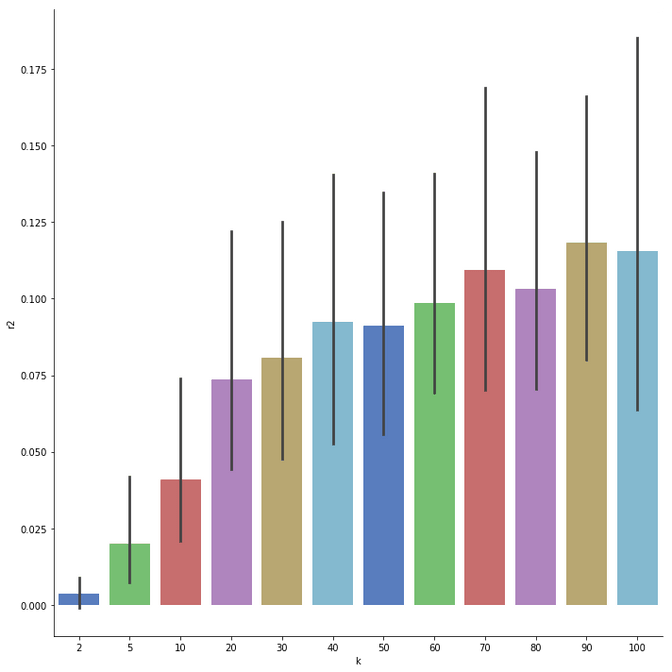
Step 4: Results
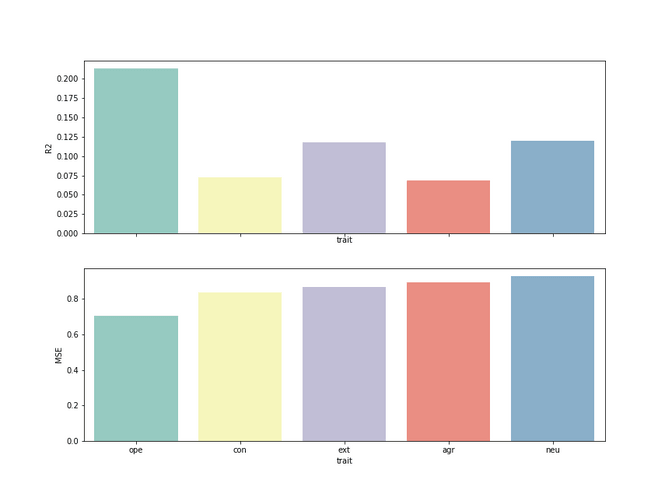
So now we can finally look at how the model performed on each trait, when using 90 dimensions in the SVD. We see that we are not great at explaining the user’s traits. Our R^2 score shows that for the most traits we can explain them only roughly between 10-20% using Facebook Likes. Among all traits openness seems to be the most predictable attribute. It seems to make sense, as open people would be willing to share more of their likes on facebook. While for some of you it might feel a bit disappointed that we were not able to predict 100% of the psychological traits for a user, you should know that in a typical re-test of psychological traits, researchers are also only are able to explain roughly 60-70% of the traits again. So we did not too bad after all. Last but not least, it's worth mentioning that if we are able to predict roughly 10-20% per trait times 5 traits, overall we know quite a bit about the user in general.
Conclusion or what's next?
From of my point of view I think this small example shows two things:
Firstly, we learned that it is hard to predict our personality traits well from JUST Facebook likes. In this example we were only able to predict a maximum 20% of a personality trait (in our case for openness). While there are of course myriads of ways to improve our model (e.g. by using more data, different types data, smarter features, better methods) quite a bunch of variance might be still remain unexplained - not too surprising in the area of psychology or social sciences. While I have not shown it here, the easiest way to improve our model would be simply to allow demographic attributes as features too. So knowing a users age and gender would allow us to improve roughly 10-20%. But this would then rather feel like one of these old-fashioned approaches. What we could do instead is to use the user's likes to predict the their gender and age ; but lets save this for another blog post though.
Secondly, we should not forget that even knowing a person's personality very well, might not transfer into highly effective political campaigns that would be able to swing a users vote. After all that is what CA promised to their customers, and that's what the media is fearing. Yet the general approach to run political campaigns in the same way such as marketing campaigns is probably here to stay. Only the future will show how effective such campaigns really are. After all Facebook is not an island: Although you might see Facebook ads showing your candidate in the best light for you, there are still the old fashioned broadcast media (that still makes the majority of consumption today), where watching an hour interview with your favorite candidate might shine a completely different light on him. I am looking forward to see if old virtues such as authenticity or sincerity might not give a better mileage than personalized facebook ads.